by Hannah Silverstein
Tests and assessments measure a variety of outcomes including skills, ability, performance, and knowledge. Cognitive-type tests have become quite common in many large scale surveys. However, these multi-topic surveys often have limited space, and can only include a short number of items. In our new paper, “Large Field Surveys and Short Items Sets: Estimating Reasoning Skills among Distinct Samples in Malawi and Zambia” recently published in Journal of Methods and Measurement in the Social Sciences, we investigate how to uncover hidden variation in response patterns of correct and incorrect answers to multiple choice questions measuring logical reasoning.
Motivation:
Logical reasoning captures a set of non-academic cognitive skills and can be measured via tests that involve series of incomplete images, called Ravens Progressive Matrices (RPMs). For each RPM item, respondents are given multiple choices from which they choose the option that best completes the image. The original RPM sets include dozens of items, however many surveys such as the Mexican Family Life Survey; Indonesia Family Life Survey; and HEalth, Ageing and Retirement Transitions study in Sweden use short sets of RPMs. Transfer Project evaluations of the Malawi Social Cash Transfer Program and the Zambia Child Grant both included eight RPMs in the questionnaires. Using evaluation data from both of these studies, we analyzed responses from youth in Malawi and caregivers in Zambia to RPM questions.
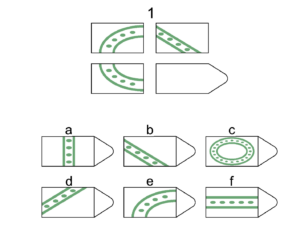
Example RPM from Malawi and Zambia short sets
The problem:
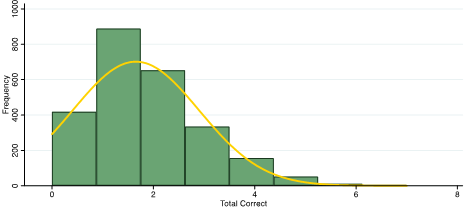
We wanted to generate scores for each individual respondent. Initially, we summed the total number of items answered correctly. We quickly realized that this approach had limitations because the RPMs selected for the surveys were too difficult. In both studies about 50% of the sample correctly answered one or zero questions–in other words, our summed score distribution was highly skewed.
Distribution of summed scores among youth in Malawi
After reviewing the items and multiple choices, we also realized that some incorrect options resembled the correct choice, while others choices were very different. For instance, in the example above, D is the correct choice while choice B, though incorrect, is just a rotated image of choice D. On the other hand, answer choice C does not share visual properties with the correct answer. Therefore, some wrong choices appear to be more ‘right’ than others—picking one of these ‘almost’ correct choices ought to be considered when estimating overall test scores.
And finally, questions were not equally difficult. In general, the first RPMs in the series were much easier than the final items, suggesting that respondents correctly answering difficult items should probably have higher scores than those answering the same number of easy items.
So, the bottom line was, categorizing RPM responses into ‘correct’ and ‘incorrect’ removed a large amount of information and we wanted to find a way to use this information to estimate more accurate scores.
The solution:
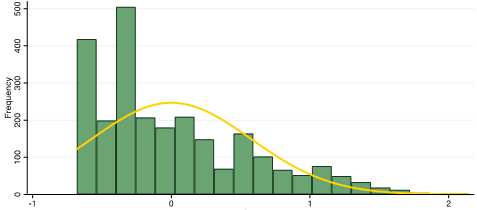
Researchers in psychology frequently use item response theory (IRT) to estimate test scores from multiple choices and questions of different difficulties. There are several different types of IRT, but we explored two types.[i] The first IRT method (IRT1) we used still categorized responses as either ‘correct’ or ‘incorrect’, but allowed for more difficult questions to have a higher weight in the overall score. The majority of scores estimated using IRT1 were still concentrated at the low end of the spectrum.
IRT1: Distribution of scores among youth in Malawi
[i] IRT1 scores were estimated using two-parameter logistic IRT. IRT2 scores were estimated using nominal response model IRT.
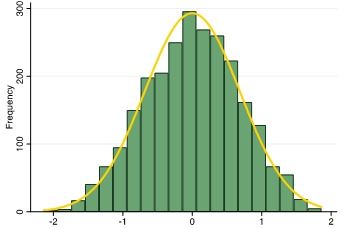
wanted to see if the distribution of the scores improved even more when using information in all possible multiple choices. The second IRT method (IRT2) we used considered all multiple choice options, while still giving more difficult questions a higher weight in the overall score. We used IRT2 to identify the best ordering for multiple choice options and to calculate overall test scores. As a result, the distribution of test scores from IRT2 were much improved—the majority of respondents had scores falling near the middle of the range of possible scores.
IRT2: Distribution of scores among youth in Malawi
Testing validity:
At this point, we had three different types of logical reasoning scores: summed, IRT1, and IRT2 scores. We needed to know if the improvements in the distribution of IRT2 scores were meaningful. So we next used all three types of scores in regression models, as outcomes and as predictors. We found our improved IRT2 scores could capture more nuance when relationships were less strong compared to the other score types. As an outcome, these scores were predicted by lower levels of education than in both countries. Among youth in Malawi, IRT2 scores were more sensitive to risk preferences. These improved scores also had more consistent relationships with future preferences among caregivers in Zambia as well.
Applicability and considerations:
As mentioned, this approach can be used to estimate scores for large datasets using RPMs. However, IRT can be used to estimate scores for many other types of multiple choice assessments types too. There are several strengths to using the 2nd IRT method to estimate scores:
- Sample response patterns inform the ordering of the multiple choice options. Roughly speaking, the most frequent incorrect response is automatically given more weight relative to a less frequently selected wrong answer. This is preferred to having the researcher decide which incorrect response is the closest to the correct response (though we tried this approach as well!).
- IRT2 scores are standardized to the sample and population under investigation not an external population different from the one being studied. Even with full RPM sets, researchers often use British norms for estimating scores. This method reduces the cultural bias from which the test was created without fundamentally changing the test itself—this is important for research in low- and middle-income countries where population level standardized norms usually do not exist. .
- Estimation in this way can be applied to challenging datasets, such as highly skewed summed scores or incomplete sets of items.
There are several conditions for this 2nd IRT approach to successfully uncover meaningful information among the incorrect responses.:
- The shorter the item set, the larger the sample size needed to analyze response patterns. In our two studies, we administered 8-item sets and had sample sizes of 2,513 and 1,173 in Malawi and Zambia respectively. These large sample sizes were crucial for having enough data to detect patterns in responses within and across questions.
- The ordering and estimation procedure is most beneficial for short item sets. IRT1 and summed scores might be sufficient approaches for estimating scores from large item sets.
- Tests that are too easy are particularly challenging. There are limits to potential improvements in measurement for tests that are too easy because there are fewer incorrect responses to work with. Individuals with only correct answer choices all have the same response pattern. For tests that are too easy, there will be little information to be gained among high performing respondents. In this sense then, it is better to err on the side of a slightly harder set than an easier set.
For more information on our process and findings please see the full, open access article.You can find the full paper here: https://journals.librarypublishing.arizona.edu/jmmss/article/id/6047/